Datavis has an option to update charts automatically, without republishing. This can be used e.g. in election nights when you get new data every hour and want to avoid that all charts have to be re-published. Every time a user updates a website with your chart, the chart will freshly get the data from the CSV.
If you’re in Step 1: Upload data, click on Link external data:
You’ll see two options: #
- Use Datavis server: Here, we try to make it as easy for you as possible to publish charts based on live data. You will need to put your CSV somewhere on the web. We will periodically download it and upload it to our server, from where it will be served to the chart viewers. The data will be updated in increasing intervals, depending on when you last published the chart (every minute in the first 24h, every hour in the next 29 days). You can republish the chart any time to reset the update period.
- Serve data file directly: This is a good option for advanced users. The data file will be served directly from your server, giving you maximum control over the cache time and update intervals. Note that your server needs to support CORS (cross-origin resource sharing), HTTPS, and also needs to be ready to handle high loads.
In the rest of the article, we’ll look at these two options in detail:
1. Use Datavis server #
To use this option, you’ll need to give Datavis the URL to a CSV:
Where could you host a CSV? #
- on your own website
- on Github: If you’re a Github user, you can upload CSVs there or access CSVs that other Github users have uploaded (for example, try to copy and paste this Buzzfeed CSV). For Datavis, you need the URL of the “raw” CSV. To get this, click on the file name of a CSV on Github, then click on “Raw” on the right. Wait until the new site is loaded, then copy and paste the URL into Datavis.
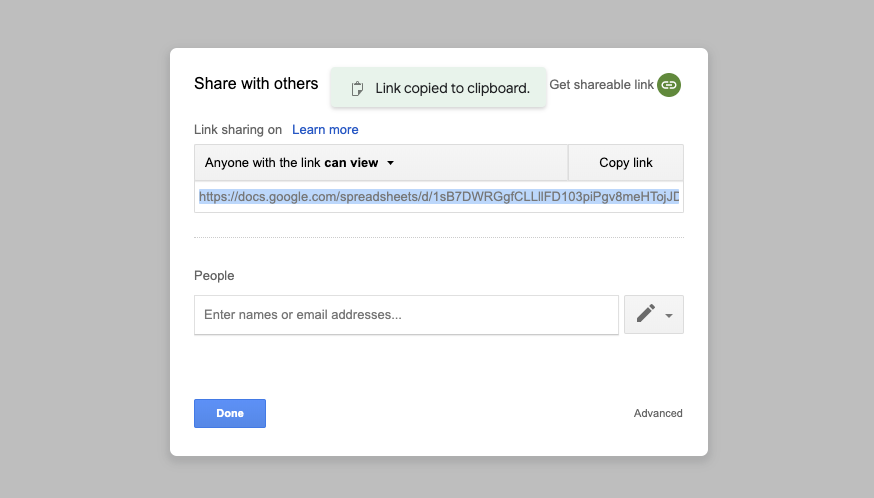
- on Google Sheets: We already offer a Google Sheets Import option in our Upload step, but if you add your Google Sheets there, it won’t update as soon as you add new data. If you update your data in your Google Sheet often and want to see the changes in the chart without needing to click “Publish” every time, select the option Link external dataset, make sure that Link Sharing is activated for your Google Sheet and paste the Google Sheet share URL into Datavis.

#
How does all of that work? #
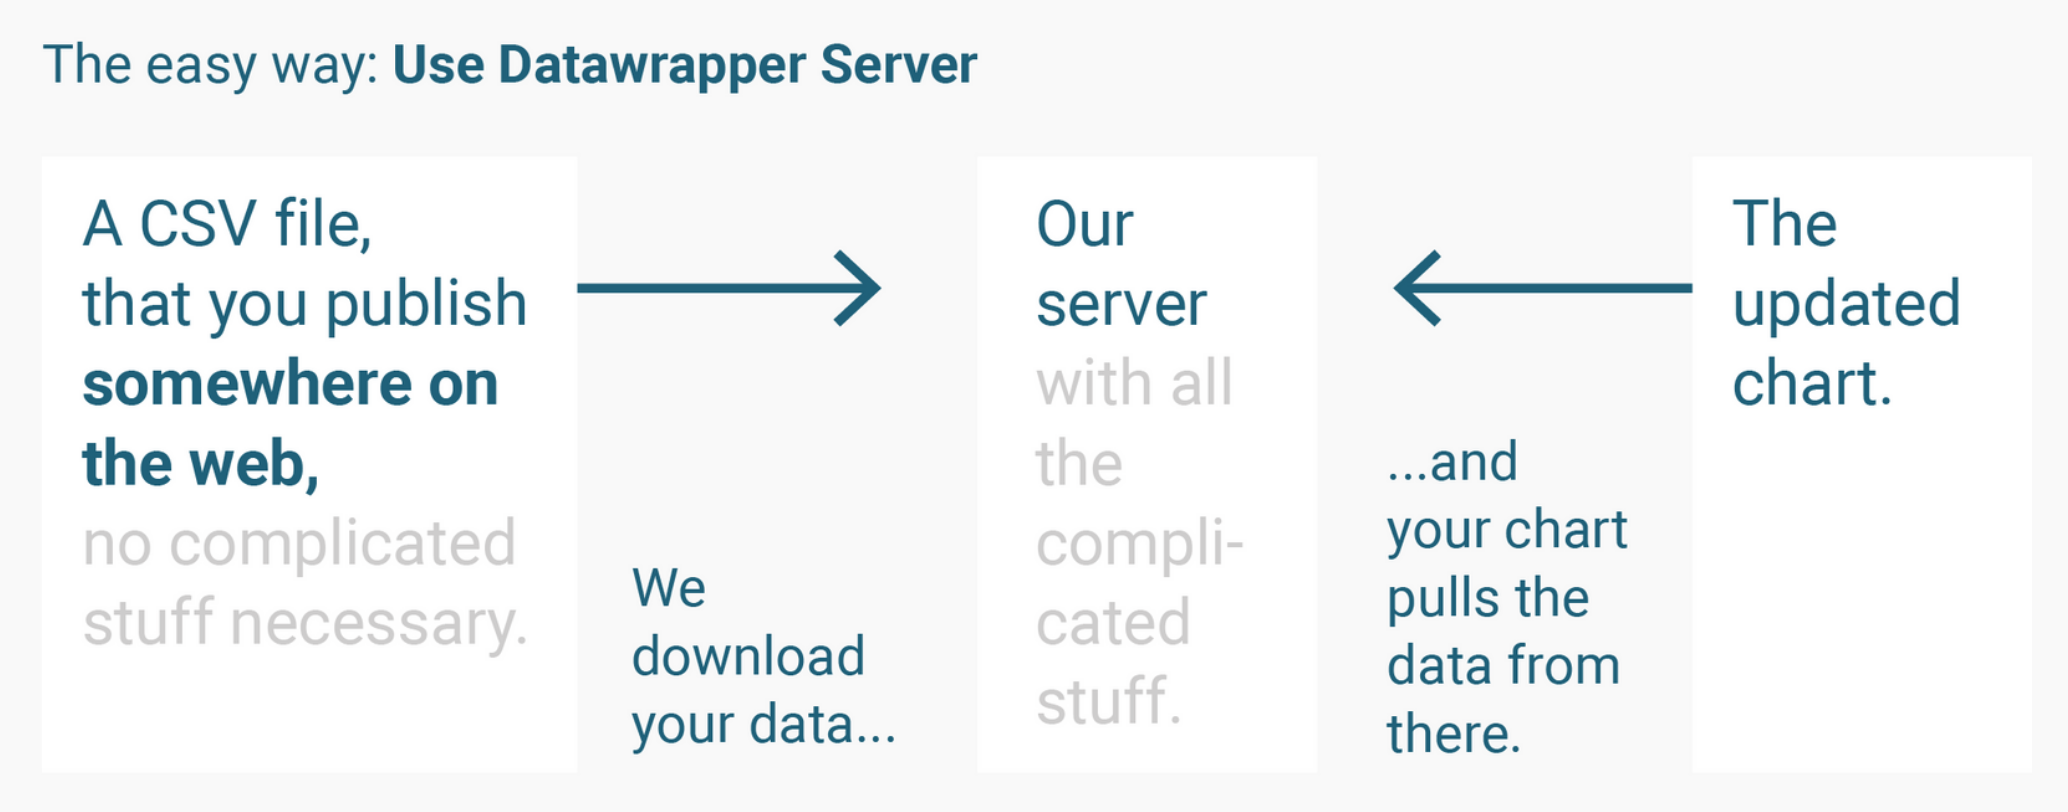
Downloading the data freshly from a CSV each time a user sees a Datavis chart is a bit tricky, technology-wise (you’ll see this in the 2nd part of this article). To make it easier, we take care of the complicated stuff for you. We decided to throw in a free data hosting service. From your website, Github or Google Sheets, we copy the CSV to our own server in certain intervals (every minute on the first day, then every hour the next 29 days), and your Datavis chart will pull the data from there:
If you don’t want to sweat about all these technical terms (HTTPS, CORS, and high traffic) and want to have full control; or if you need a higher update frequency, we still offer you the complicated way:
2. Serve data file directly #
The more advanced version doesn’t go the detour. It pulls the data directly from your CSV every time one of your readers opens a website with a chart:
To make that possible, your external data file needs to be publicly accessible under a URL that supports cross-origin resource sharing (CORS), HTTPS and can deal with high traffic. Then enter the URL of the data file you uploaded in Datavis. For testing purposes, you can copy and paste this URL: https://vef.vn/test-data/movies.csv
Again, Datavis will immediately test if the URL is configured correctly. If everything is green, your data was imported successfully:
After uploading the data, you will be able to see the data in Step 2: Check & Describe, as usual. If you change the data there, the changes in step 2 won’t be overridden when the data is freshly pulled from the server. However, if you change cells in step 2 and the updated data contains new rows, the cell will jump and your data will be a mess. There’s no problem changing the column names, though, especially if the number of columns stays the same.
After publishing your chart, you’ll have a live chart, that will always load the data from the URL you entered.


